Values and returns shown in the chart are for illustrative purposes only and do not reflect actual returns.
What happened?
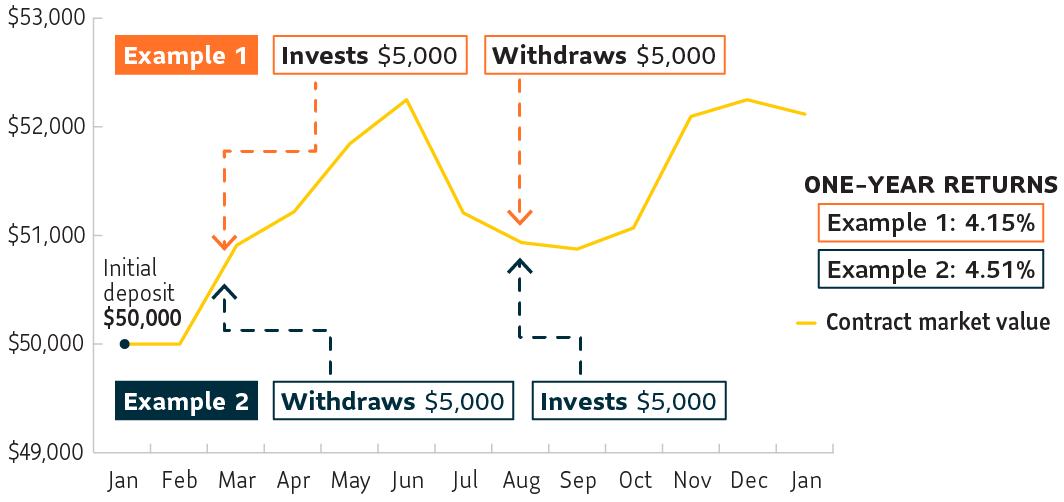
The chart shows the money-weighted rate of return of a fund over the course of a year. There are two examples; each uses the same dates and amounts, but reverses the deposit and withdrawal actions.
Example 1
You deposit $50,000 into your contract in January. In March, you deposit another $5,000 while the market is increasing. In August, you withdraw $5,000 while the market is decreasing.
The result: The overall rate of return is 4.15%. This example shows a withdrawal when the market was down.
Example 2
In January, you deposit $50,000 into your contract. You use the same dates and amounts, but you reverse the actions. In March, you withdraw $5,000. In August, you deposit $5,000.
The result: Even though you moved the same amount of money in and out of the contract, your return is 4.51%. By withdrawing money as the market increases in March and re-investing August, you benefit from the market increase that began in October.
Questions?
To learn more about your rate of return, talk to your financial advisor.